Finding Compilation Slowdowns Using Windows Performance Analyzer
Thanks to the efforts of a few dedicated folks who wrote a C99 to C89 converter, ffmpeg and libav can now be compiled with Visual Studio. Almost as soon as support for MSVS was pushed to the various repos, however, it became evident that something was wildly wrong. While some people were able to compile the code in a matter of minutes using all of their available processor cores, others were seeing their builds take hours. No matter how many instances of cl.exe they spawned at a time, only one core was being used at a time, while the rest sat idle. With nothing obvious to blame, it’s time to bust out the Windows Performance Analyser.
30 Second Introduction to WPA
The Windows Performance Analyser (WPA), along with the Windows Performance Recorder (WPR) and XPerf, are part of the Windows Performance Toolkit (WPT), part of the Assessment and Deployment Kit (ADK) available from Microsoft. Somehow XPerf managed to squeeze in there without a three letter acronym, an oversight I’m sure will be fixed in future versions. Prior to Windows 8, WPA was available as part of the Windows SDK. If you happen to have installed this version for some reason or another, stop what you are doing, find an exorcist, and cleanse your computer of this atrocity. The old UI and command line tools still come with the new version, but thankfully you’ll never need to use them.
WPA is like pivot tables on steroids The initial view you are presented with is a selection of graphs, but each of those is sitting on top of fantastic selection data. All you have to do is understand how to interpret the data. In this investigation we’ll be using two tables and graphs – the sampler profiler (CPU Usage (Sampled)) and context switch (CPU Usage (Precise)).
The sample profiler is exactly what the name implies. Every millisecond (configurable, but don’t bother) it captures the call stack of every thread that is currently running on the system. Each sample becomes a row in the table. Viewed in aggregate, these samples are excellent at showing where your program is spending its time. When you start to zoom in to the millisecond level, though, its limitations start to become apparent. Threads that run for less than 1ms may be completely missed by the sampler, or else they may show up as running for the full millisecond. Bruce Dawson has written an excellent introduction to what each column in the table means at his blog: http://randomascii.wordpress.com/2012/05/08/the-lost-xperf-documentationcpu-sampling/. Just keep in mind that he’s talking about the old UI, though many of his complaints are still quite valid.
The context switch table doesn’t have the resolution issues that the sample profiler does, as each row in the table represents a context switch. You simply can’t get more finer resolution than that. Unfortunately this data is endlessly complex, as the list of all the columns in the table suggests. For seeing where a program is spending all its time executing, the sample profiler is almost always a better bet. When you want to see why your program is not running, however, the context switch data is infinitely useful. In addition to showing which thread was being context switched out, and which is getting switched in, it also shows why each thread was being switched, and their call stacks. In case the thread being switched in was waiting on an event, it will also show the call stack of the thread that signalled the event. Bruce Dawson also wrote an excellent introduction to this table as well, with the same caveats about the UI: http://randomascii.wordpress.com/2012/05/11/the-lost-xperf-documentationcpu-scheduling/.
The Good
In order to see what’s going wrong, it’s helpful to first see what compilation on a machine with no problems looks like. Below are some screenshots from a Core2 Duo 6600. The first one is pretty simple – it shows both processors being fully utilized for pretty much the entire length of the trace.

The second screen shot is a bit more complex. The graph is a stacked line graph, and like the task manager, each processor only accounts for 50% of the graph. It’s been zoomed in to a very small time range, .3 seconds, as well as filtered to only contain the cl.exe processes. At this scale it’s easy to see that the four cl.exe processes are switching on and off the two processes. Actually, it’s not that easy to see, because two of them are the same shade of blue, but use your imagination.

The Bad
So now that we know what compiling should look like, let’s see what’s going on with the machines that are slow. To start, a simple overview of the activity on all the processors. This was taken on a 8 core Mac Mini.

All those processors. Doing nothing at all. Let’s zoom in some more.

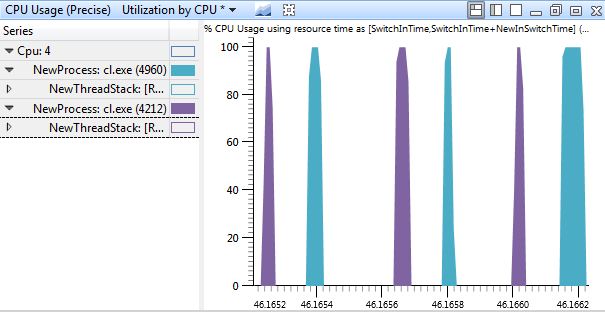
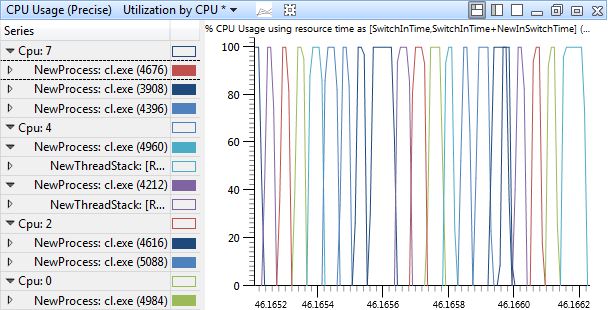
All those processors… are taking turns running. And sometimes just sitting around doing nothing at all. If nothing is running concurrently, that would explain why the builds are taking so long and the overall CPU usage is so low. But where did all the parallelism go? There’s at least 8 cl.exe processes running at any one time, they must be bottlenecked on something. Could it be the disk?

Nope. This single graph isn’t enough to definitively say yes or no, so you’ll just have to trust that I investigated it more and found that the disk isn’t an issue. In fact, the disk is pretty idle, as is everything else that might potentially be an issue. The machine is also using the High Performance power profile, so the processors shouldn’t be powering down, and there should be no core parking problems.
So if the machine is mostly idle all this time, what could possibly be causing this issue? Why isn’t cl.exe running constantly, on all the available processors? As I mentioned in the overview (you did read that, right?), the best way to tell why a program isn’t running is to check why it was context switched out. Zooming in to the level of individual context switches and filtering to just one processor shows that each process is being context swapped out after a short period of time, and nothing else is getting swapped in. It’s almost as if they are sleeping for some short amount of time.

Removing the filtering to processor 4 reveals something more. Even though there are 8 available processors, each process is sitting around waiting for the others to finish before it runs again.

Intuition says they are waiting on a lock of some sort, but why would cl.exe need such a thing, and why would it only show up on certain machines? At this point it is time to turn to the information in the table to. Of interest here is why each process is being switched out and why it later gets switched back in. The NewPrevWaitReason columns shows why the thread that is being context switched in was last switched out, and the ReadyingProcess and ReadyingStack columns will show what caused the process to leave the waiting state. Similarly, the NewThreadStack column will show the call stack of the thread being context switched in, which will be the same as the call stack that was executing when it was last switched out. If the thread called Sleep or WaitForSingleObject or something, it should show up here.
Selecting one of the context switches at random, we can see that its NewPrevWaitReason is WrResource. Some Googling shows that this isn’t documented anywhere, but judging by the name, it seems to imply that the thread was waiting on some resource (such as a lock). So far, so good. The ReadyingProcess is another cl.exe – the one that was running immediately before this one. If we look at that process’s ReadyingProcess and NewPrevWaitReason, we can see the same thing going on. Each process does some work, signals the next process, then waits.
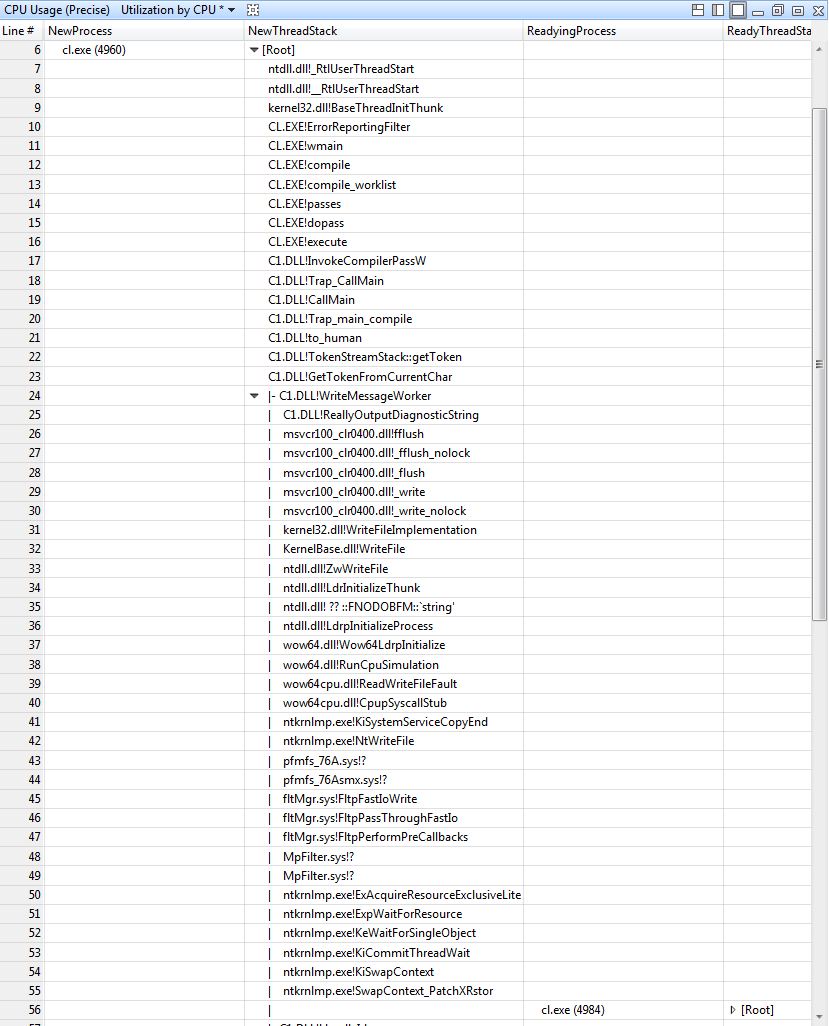
Now that we’ve established that there is a giant chain of waiting processes, the next step is to determine what they are waiting on. Using the NewThreadStack we can see precisely what is going on. Skipping down to the bottom, we can see a call to WaitForSingleObject, exactly as expected.

Starting from the top, we can see that cl.exe is performing some work, then writing some output (C1.dll!ReallyOutputDiagnosticString). This ends up calling WriteFile in kernelbase.dll, which then calls down into NtWriteFile in the kernel itself, ntkrnlmp.exe. From here the various drivers and minifilters that are installed get to look at the I/O – first up is pfmfs_76A.sys, which is a driver for mounting disk images. This appears to not be interested in this write, and just passes it through to the next step. Next up is MpFilter.sys minifilter, which is Microsoft Security Essentials, Microsoft’s antivirus program. While there are no symbols available to tell exactly what this is doing, we can see that it calls into ExAcquireResourceExclusiveLite, which ends up calling KeWaitForSingleObject, which in turn causes the thread to enter the waiting state and get context switched out. Browsing the stacks for the other cl.exe processes shows MpFilter.sys waiting on some object in all of them. Highly suspicious.
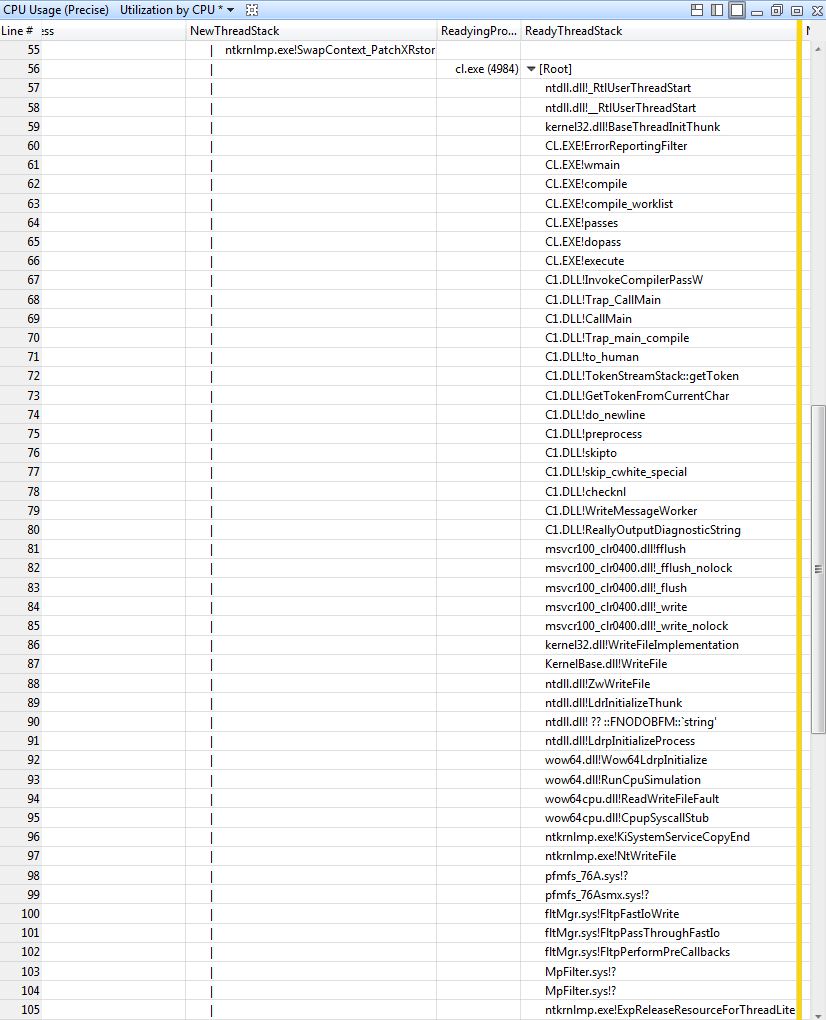
For the sake of completion we can look at the ReadyThreadStack, to verify that the releasing of this resource is what causes the next process to wake up.

And indeed this seems to be correct. The call to ExpReleaseResourceForThreadLite is responsible for waking up the next cl.exe in the wait chain.
The Verdict
Without looking at the code to MpFilter.sys we can’t say for sure what is going on. Using the data shown in WPA, however, we can say that it is extremely likely that MSE is trying to scan every write to the disk, and that some part of this scanning process is not thread safe. This is having the effect of bottlenecking all the concurrent IOs. Uninstalling MSE causes the problem to go away (disabling real time scanning is not enough). Suspicions confirmed, problem solved!
If it were really the case that only one IO could be active at a time, you’d expect to see the entire computer grind to a halt and MSE to be the laughing stock of the internet. Instead, this problem only seems to occur when compiling ffmpeg with the C99 to C89 converter. What’s going on? One of the steps of the conversion process is to preprocess the C file and write it back out to disk. Looking closer at the file IO being performed, it appears that these writes are occurring One. Byte. At. A. Time. And each write is triggering MSE. Even assuming MSE only needs to acquire its resource very briefly, the high frequency of the writes is causing this to essentially turn into a giant global lock on all file IO. Had the files been written out in larger chunks, it is likely that MSE would cease to be a bottleneck and the cl.exe processes could operate concurrently.
